Reproducible data science with WebAssembly and webR
Reproducibility in Data Science
At the language level
It works on my machine ¯\(ツ)/¯
Hard-coded paths,
setwd(), project organisation.Source code management,
git, GitHub.Defensive programming, handling error conditions.
Organising software into modules or packages.
Documentation and tests.
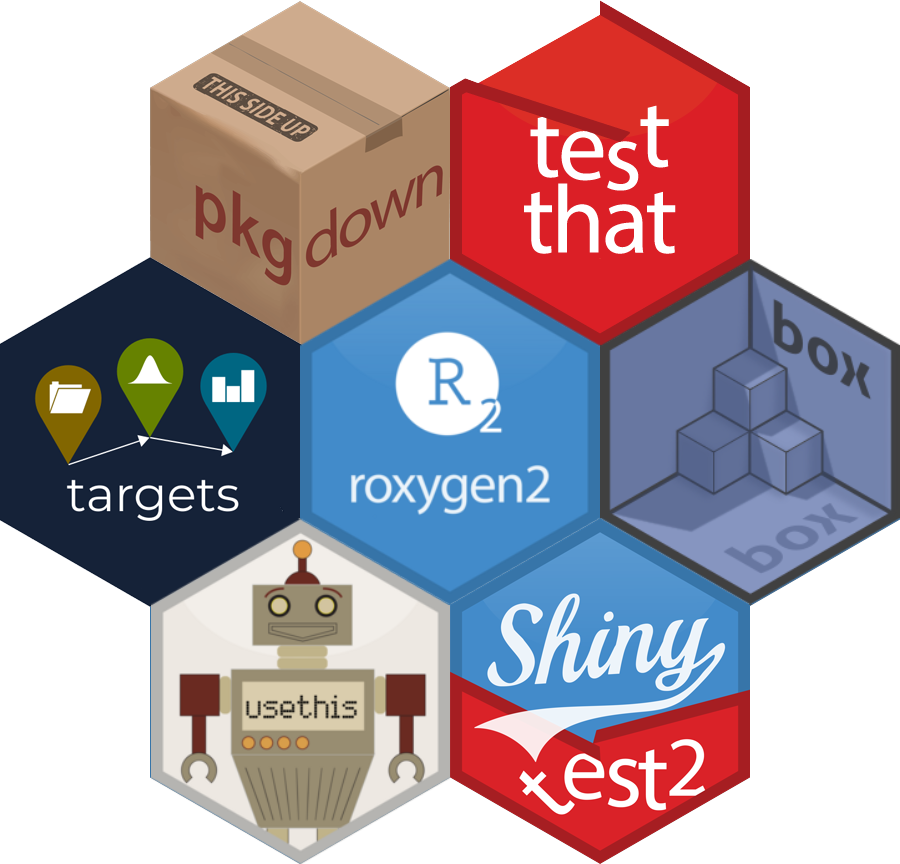
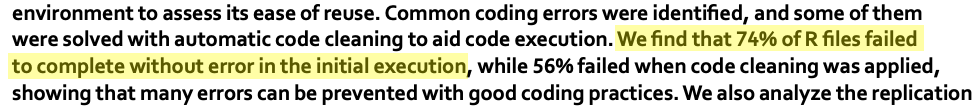
A small effort here, even using automated tools, makes a big difference.
Binary-level differences
The same software can give different binary output depending on the type of hardware
(e.g. ARM vs x86_64 vs RISC)
![solve(matrix(c( 1, 3, 11, 0, -11, -15, 18, 55, 209, 15, -198, -277,-23, -33, 144, 532, 259, 82, 9, 55, 405, 437, -100, -285, 3, -4, -111, -180, 39, 219,-13, -9, 202, 346, 401, 253), nrow=6, byrow = TRUE))[[1]]](images/matrix.png)
WebAssembly
- A portable binary code format
- Enables high-performance applications on web pages
- Near-native execution speed
- Supported by most modern browsers
- Interactive through JavaScript integration

Also provides benefits for security in the form of containerisation and sandboxing.
R for WebAssembly: webR

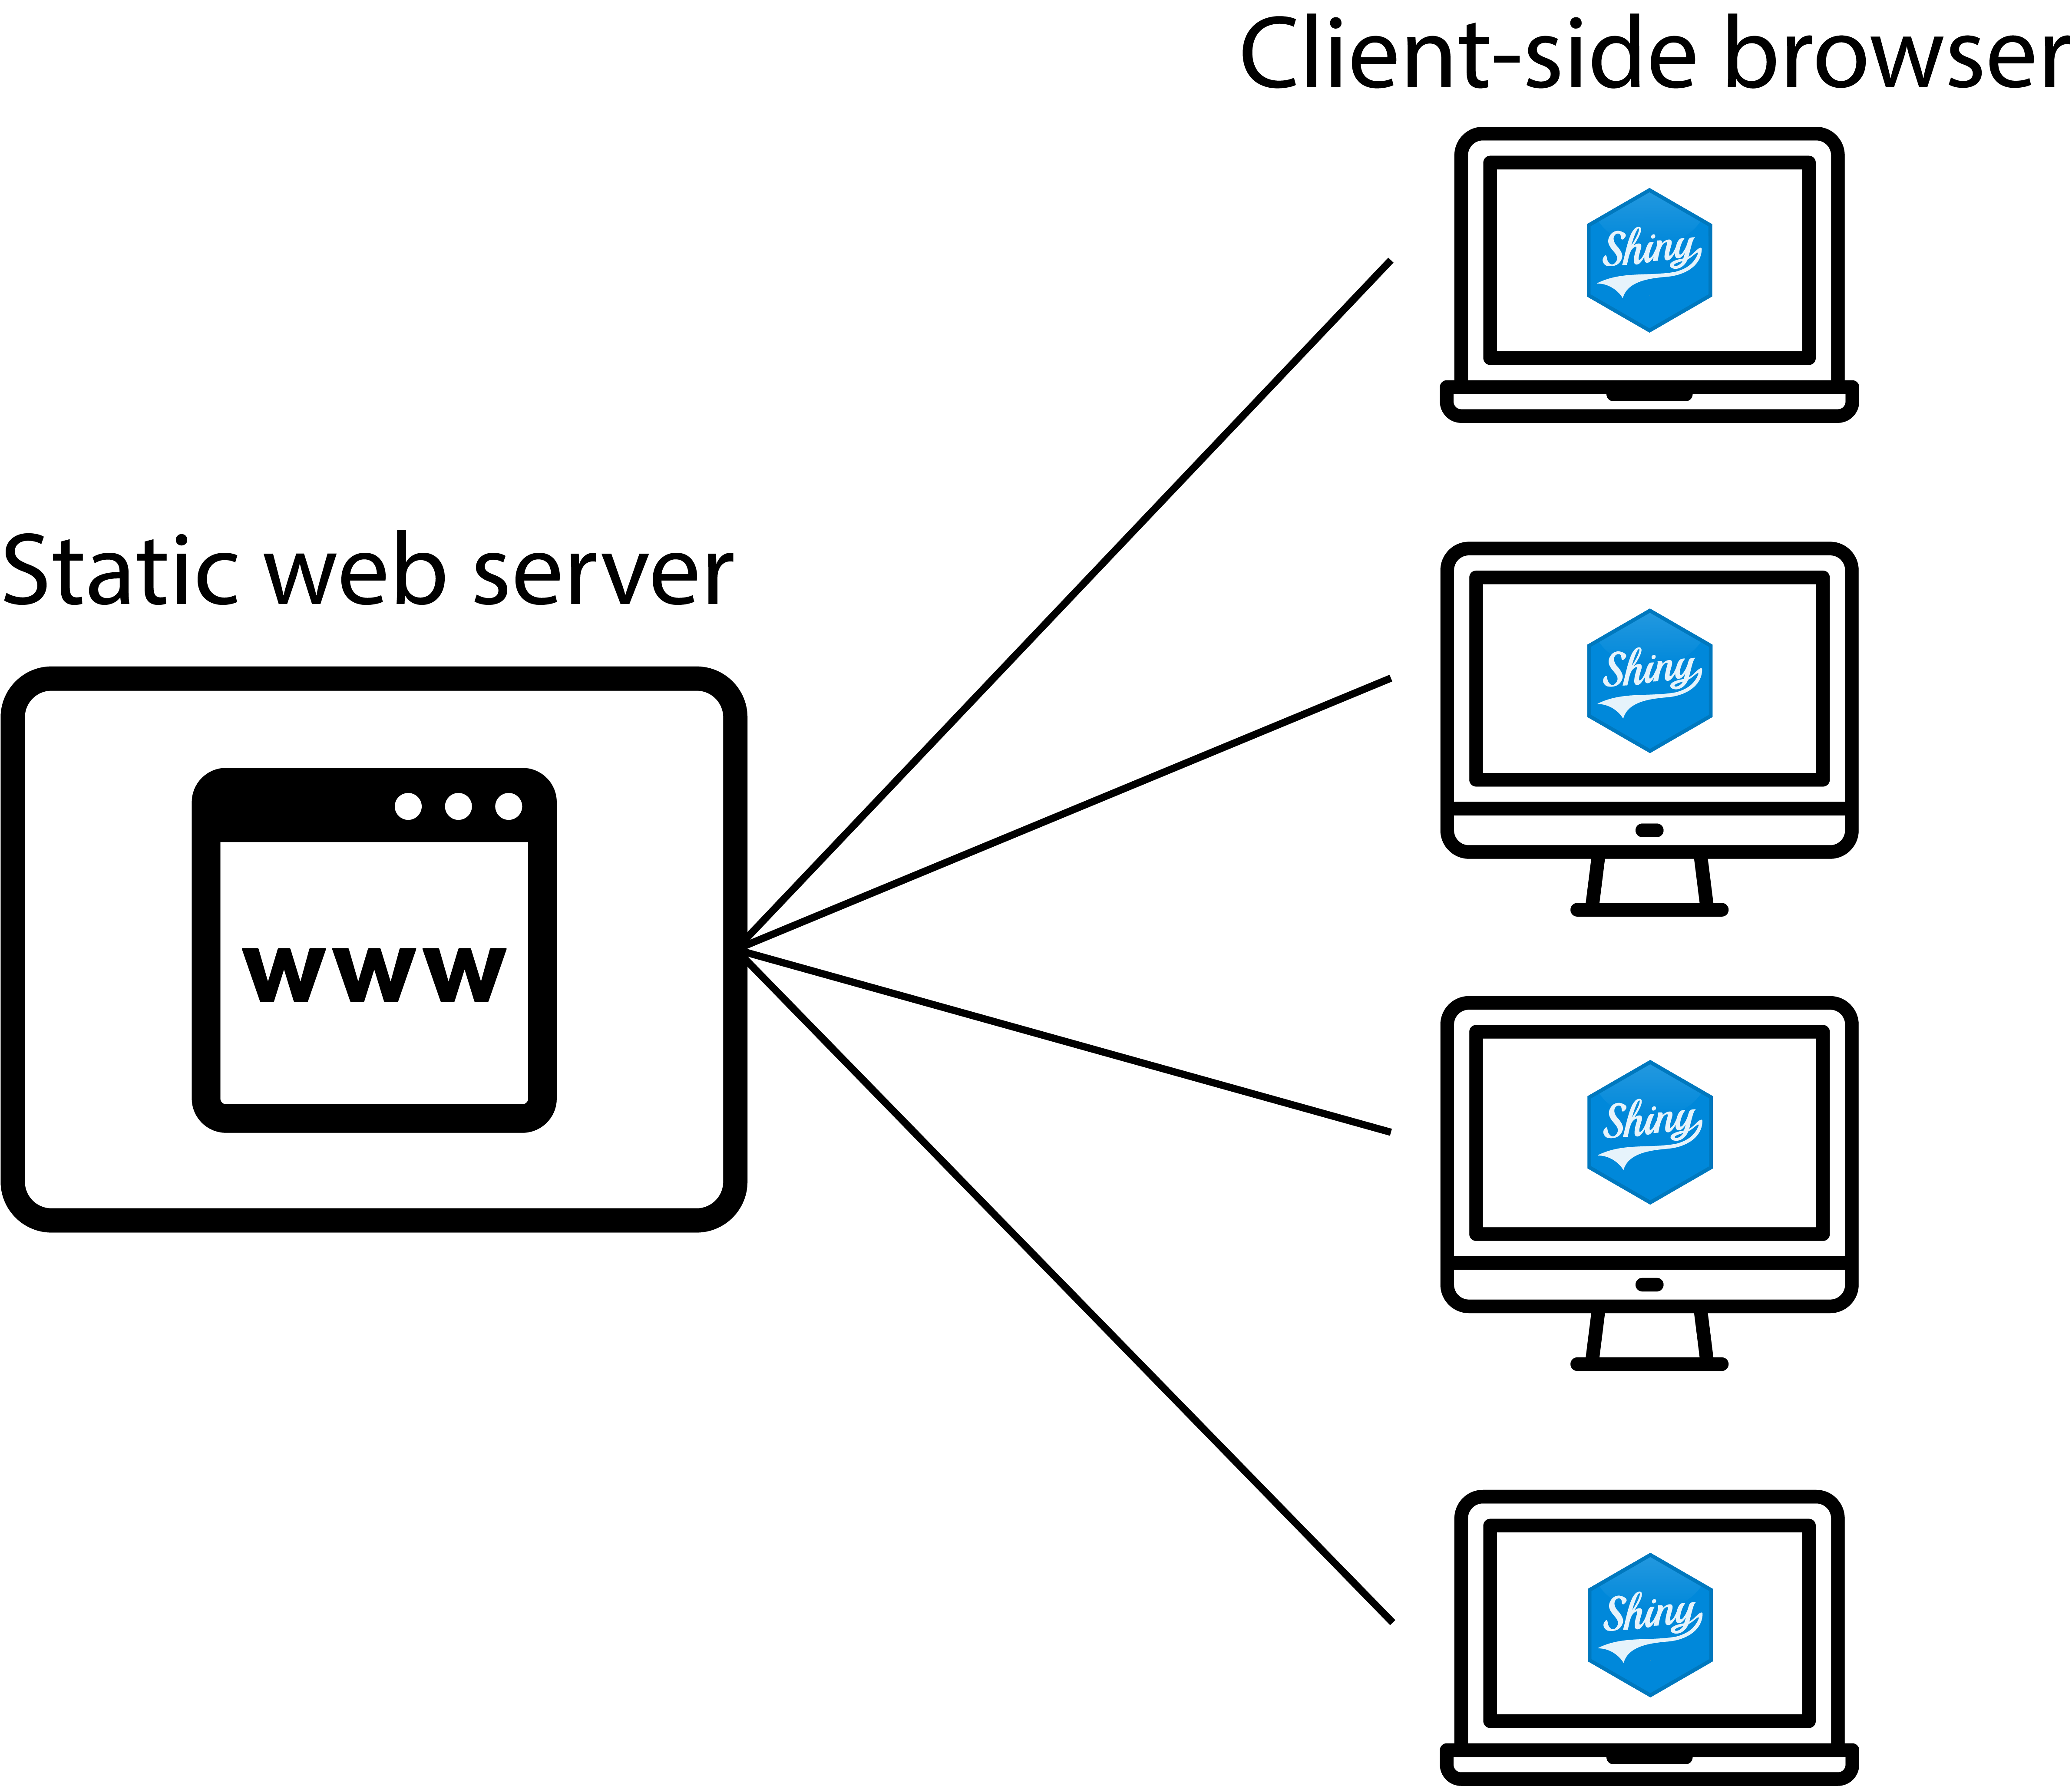
The webR project is a version of the R interpreter built for WebAssembly.
Execute R code directly in a web browser, without a supporting R server. Alternatively, run an R process server-side using Node.js
Available on GitHub and NPM as a JavaScript & TypeScript library.
R Consortium Submission Working Group
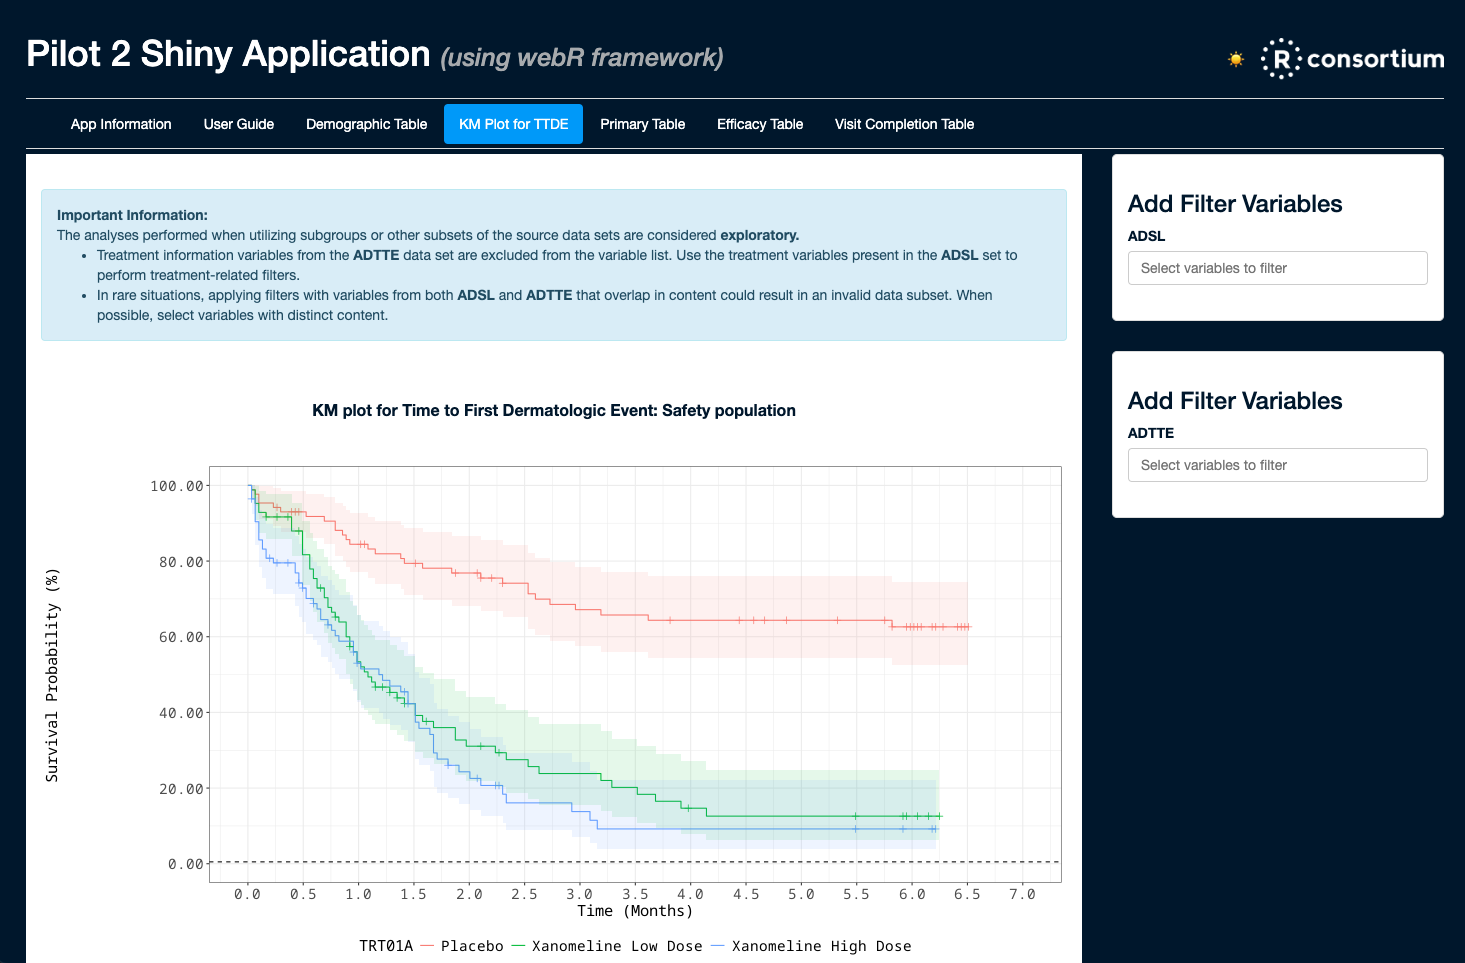
🔗 Testing Containers and WebAssembly in Submissions to the FDA - pharmaverse.github.io
Traditional Shiny App

Shinylive App 🔗 https://shinylive.io/r/
- Github Pages
- Netlify
- Quarto Pub
- Lots more…
WebAssembly R packages
Binary R packages for Wasm are available from a CRAN-like CDN:
Over 65% of CRAN packages available for webR
Build custom Wasm package repositories at 🔗 https://r-universe.dev

What if R packages change?
R packages are always updating and changing.
Wasm R package binaries will be frozen and bundled with an app automatically.
Apps will continue to work in the future, even as Wasm package repositories update.